A useful tool you can use as a photographer is the camera histogram. But what is it, and how can it help your photography?
Taking photos can be very complicated with modern digital cameras. They have lots of buttons and dials. And displays like a histogram can be hard to understand!
Our brief self-help article will show you how to read a histogram. And you’ll be able to use it to improve your photo’s exposure and avoid lost details (clipped shadows and highlights).
Histograms are a feature found in most modern DSLRs and mirrorless cameras. And you might even find one on a few compact or bridge cameras.
They’re also available in most editing programs, such as Adobe Lightroom and Photoshop. So you can play around with them using your camera or as part of your post-processing workflow.
Generally, a camera histogram illustrates a photo’s exposure. So it’s easy to see the difference between well-exposed, underexposed, and overexposed images.
More specifically, a histogram is a column chart that shows the number of pixels in an image at every brightness level.
There are 256 individual columns, from zero on the left (pure black) to 255 on the right (pure white).
A higher vertical axis represents more pixels at that particular brightness level. So it’s a bigger part of the frame.
The greater the span of columns on the horizontal axis, the greater the dynamic range.
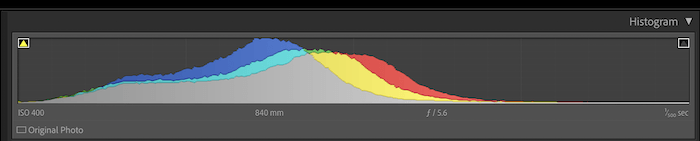
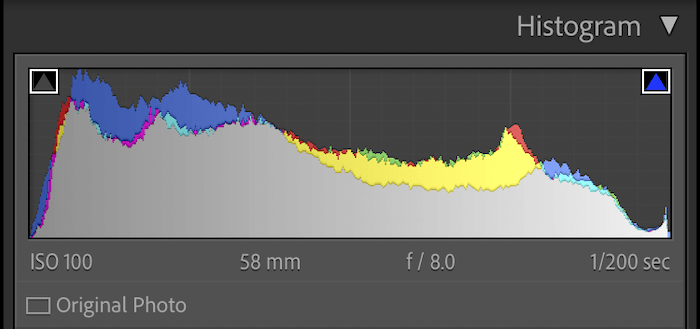
Most histograms show one set of values and are grey. But some also show curves for the primary colors (red, green, and blue).
The principle is the same. But the RGB version shows more information and is often more accurate.
So the histogram shows the overall exposure at-a-glance. Plus, it shows the dynamic range from the darkest to the brightest areas.
Cameras all have different interfaces. So you might have to consult the manual or do an online search to find out how to show the camera’s histogram.
But there’s usually an option in playback that you can access. Press the display or information button a few times.
If you look more deeply at the menus, you might even find an option to display the camera histogram while taking pictures.
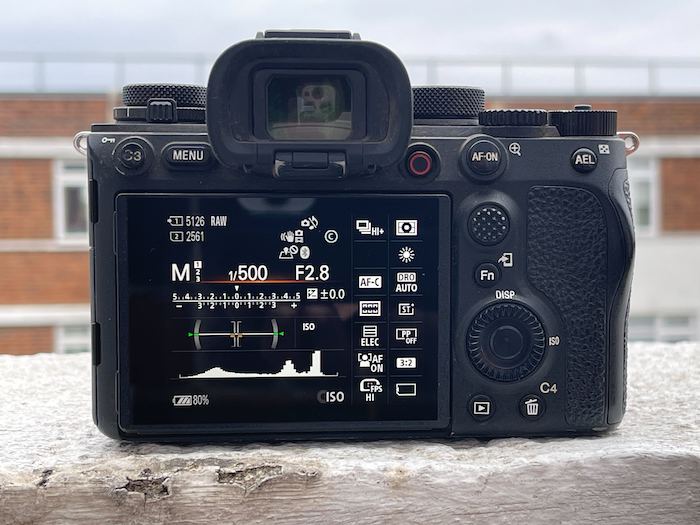
If you have a DSLR camera, this will only be available in Live View. But most mirrorless cameras can also show it in the electronic viewfinder (EVF).
The histogram is usually shown by default if you’re using an editing program. In Lightroom, it’s at the top of the right-hand panel in the Library and the Develop modules.
If you can’t see the chart, click the arrow next to the Histogram label, and it should appear.
Histograms help photographers get the correct exposure and avoid highlighted or shadowed areas without any detail. There are two main ways to read a histogram:
Modern cameras have sophisticated built-in meters that do their best to guide you to the correct exposure.
Manufacturers program meters with the idea that the world reflects 18% of the light falling on it. So the camera will try to show that in the pictures you take.
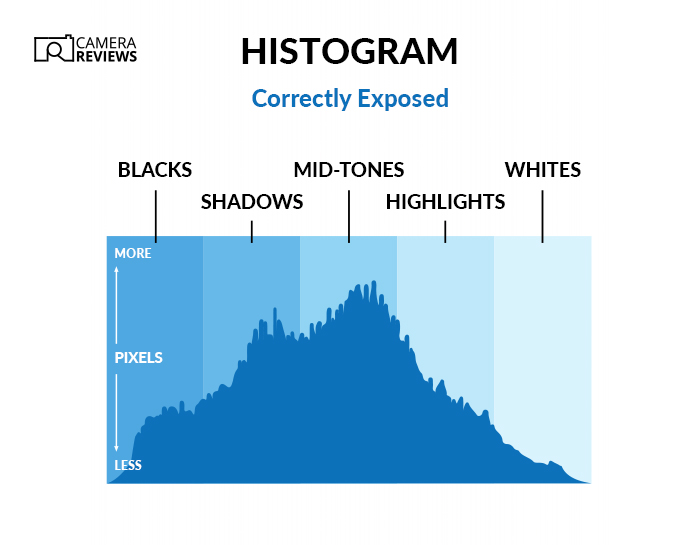
You should see a balanced histogram if you take a well-exposed image of a “normal” scene. This would be taller columns in the middle, with a gentle decline in their height towards the edges.
If it doesn’t have this “normal” distribution, it’s a good sign the picture isn’t properly exposed.
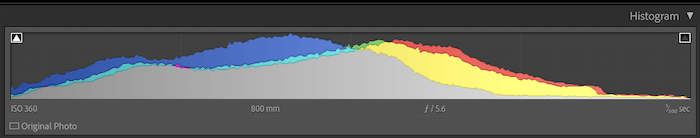
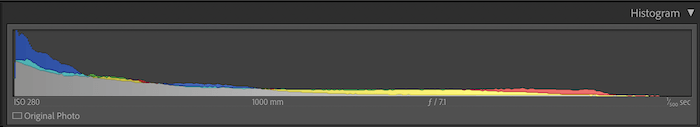
If the curve is skewed to the left, there are more dark pixels than there should be. This shows the shot is underexposed.
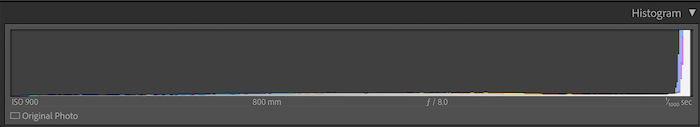
If skewed to the right, it’s probably an overexposed image.
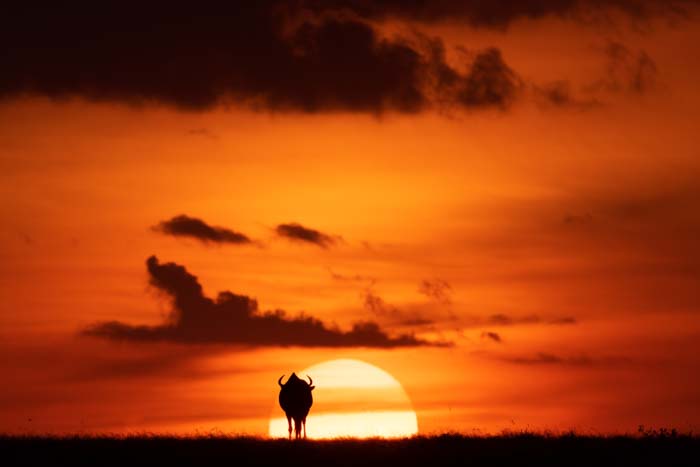
But some scenes are much darker or brighter than average. If you take a picture of a black bear in the forest, it’ll be very dark.
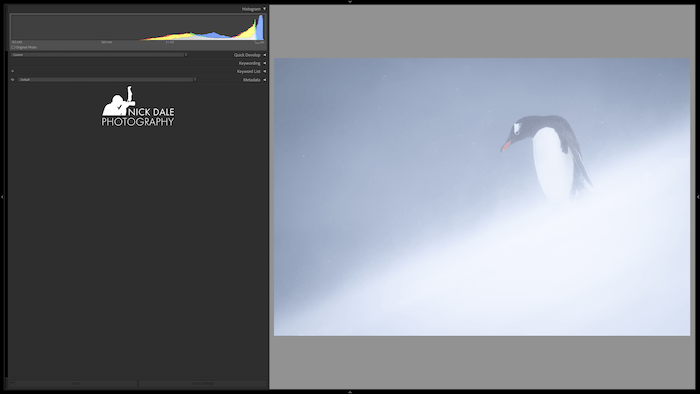
Equally, it’ll be very bright if you take a picture of a polar bear on an ice floe. This is normal. And you’ll probably use exposure compensation to get the “right” exposure.
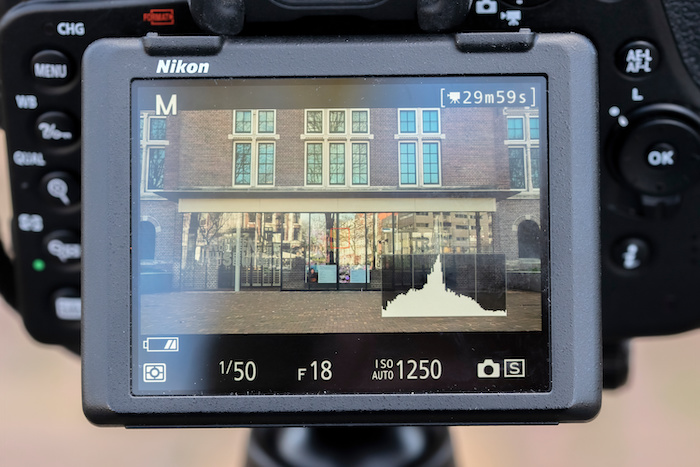
In that case, a skewed histogram doesn’t mean your shot is wrongly exposed. It just means you’ve deliberately adjusted the brightness (see the image below).
Looking at the overall shape of the curve, then, won’t necessarily tell you if you’re underexposing or overexposing your images.
But it’s a better guide than simply looking at the scene or the shot in the viewfinder or on the LCD.
DSLRs have an optical viewfinder that doesn’t show you what the actual picture will look like. Mirrorless cameras have a “what you see is what you get” (WYSIWYG) EVF and LCD screen.
This means mirrorless cameras show you the exposure in advance. But it still depends on the brightness levels you set in the menu system and how bright the natural light is.
If you’re reviewing images, the brightness of the camera’s LCD screen might mislead you. It may make you think they’re either too dark or too light. That’s where the histogram comes in handy!
One of the exposure problems photographers have to solve is avoiding areas of shadows or highlights that are too dark or bright to show any detail. (Also known as “clipping.”)
If you have “crushed” shadows or “blown-out” highlights, you’ll never recover those areas, however much you brighten or darken them. So your pictures will never win any awards!
The best solution is to get it right in the camera. Shooting in RAW helps as RAW files save more information than compressed JPEG files.
This means you can recover more detail in post-processing. It also helps to check your histogram. You can display it in the EVF (if you have a mirrorless camera) or on the camera’s LCD screen.
Some photographers like to take “test shots” and then review them on the back of the camera. You can also check the camera histogram graph while you’re taking pictures.
It’s up to you. Although it also depends on the type of camera!
To avoid shadow clipping and blown highlights, all you need to do is make sure the ends of the curve don’t get pushed up against the sides of the histogram.
The first column on the left shows pure black tones with no detail. So you want this to be as low as possible.
The same goes for the very last column on the right. It shows pure white tones. So you want it to again be as low as possible.
Now, there’ll always be some occasions when you can’t avoid clipped shadows or highlights. Photographs of the night sky might have pure black in them for a good reason.
The midday sun is also so bright that it’ll almost always show clipped highlights. But you still want to avoid clipping your shadows and highlights in most other situations.
Once you’re comfortable with reading the histogram, there are a couple of other ways you can use it to improve the exposure of your images.
“Exposing to the right” is a way to shoot photos. It is a way of reducing noise and improving image quality by overexposing the image slightly.
It gets its name from when the curve on the camera histogram is pushed to the right. This means there are more areas with brighter pixels. And these are easier for the camera to pick up.
These pixels have a higher signal-to-noise ratio. So they stand out against the random electronic interference that even modern digital sensors tend to pick up.
If you have a program like Lightroom, you can reduce the highlights and whites in the final image to bring them down to the right level.
Plus, the shadow areas are brighter than they would’ve been. So they don’t have to be “opened up” (or brightened).
This means they’re much less likely to show color or luminance noise. Examples of this would be blotchiness and other “artifacts.”
It’s hard to say what the “right” amount of exposure compensation should be. It depends on the light level and how many shadow areas there are.
But two-thirds of a stop is probably a good starting point—or maybe one-third of a stop with a mirrorless camera.
The exposure mode also makes a difference in the noise levels. If you shoot in Manual mode with Auto ISO, the camera will raise the ISO for the best level of positive exposure compensation.
The higher ISO naturally leads to more noise, which takes away some or all the benefit of “exposing to the right”!
The solution is to go to full manual, shutter, or aperture priority mode and set ISO manually. Then the higher exposure must come from a wider aperture or a slower shutter speed.
When editing your images in Lightroom, you can use the histogram in a couple of other ways that aren’t available to you in your camera.
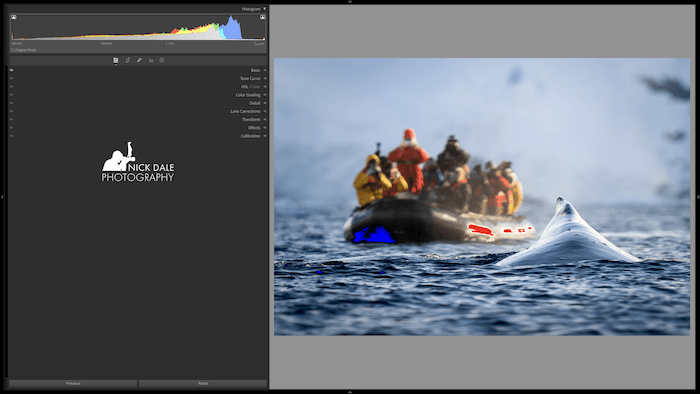
The first thing you can do is switch on the Show Shadow Clipping and Show Highlight Clipping indicators. They are the small triangles in the top corners of the histogram.
Go to the Develop module (press “D” or click the Develop menu item). And press “J” to show both indicators (and hide them afterward).
Now, any clipped shadows or highlights will be shown by white triangles in the indicator boxes. You’ll also see crushed shadows in blue and blown-out highlights in red on the image itself.
This is a very useful visual tool. But lost highlight detail looks worse than crushed shadows.
So you might want to turn on only the Show Highlight Clipping indicator. You can do that by simply clicking the white square box to toggle it on and off.
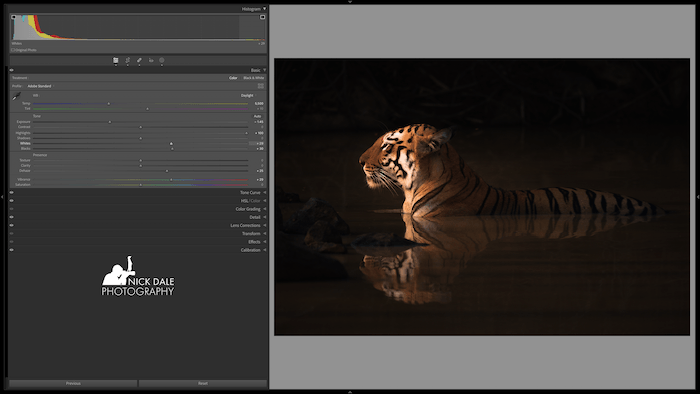
One useful function available in Lightroom is the ability to adjust the exposure of an image directly with the histogram.
If you hover your cursor over the chart, you’ll see that it’s divided into five sections:
If you want to change the overall exposure, you can click and drag the Exposure section of the histogram. Moving it to the left makes it darker, and to the right makes it brighter.
A label appears in the bottom-right corner to tell you how much of an impact you’re making. It goes from -100 to +100.
If you’re more concerned with the Blacks, Shadows, Highlights, or Whites, you can also click and drag those areas. But the amount of adjustment is limited.
For instance, if you click and drag the Blacks to the right, the Blacks might show +100. But the rest of the histogram won’t move very much.
This is the same as moving the individual sliders in the Basic panel in the Develop module. You can see the effect directly if you keep that open while editing the histogram.
It’s up to you which way you prefer to make changes. It comes down to preference.
Learning how to read a histogram can be very useful. It helps you see the dynamic range and control the exposure when taking, reviewing, or editing your pictures.
It may look complicated, but it’s simply a frequency chart showing how many pixels are at each brightness level, from pure black to pure white.
You can use the overall shape of the curve to judge the exposure of the whole image. Just remember that some scenes are naturally darker or brighter than average.
You can also preserve shadow and highlight detail by ensuring the histogram’s first and last columns are as low as possible.
For advanced users, it’s possible to use the camera histogram to “expose to the right” to reduce or avoid noise.
And if you’re a Lightroom user, you can switch the clipping indicators on and off in the histogram. Plus, you can adjust the exposure directly by clicking and dragging each section.
Here are answers to the most frequently asked questions about histograms.
It shows tonal values—shadows on the left, highlights on the right, and mid-tones in the middle.
Learning how to read a histogram helps you understand the distribution of brightness levels in an image.
This helps photographers analyze and optimize exposure. And you can avoid overexposed or underexposed areas by adjusting the aperture, shutter speed, or ISO settings.
For well-exposed photos, there should be an evenly distributed graph across. So no significant spikes or gaps at either end.
It should show a good balance of dark tones, mid-tones, and bright highlights. (From shadows on the left to the highlights on the right.)
But the ideal histogram may vary depending on the scene and desired creative effect.
To view the camera histogram on a Canon, follow these steps:
You can display the camera histogram in the electronic viewfinder with a mirrorless camera. The setup depends on the camera’s make and model.
With Canon cameras, you must navigate to the menu system’s Display or Viewfinder Display options. With a Sony a1 or Nikon Z9, toggle through the options using the display button.